Overview
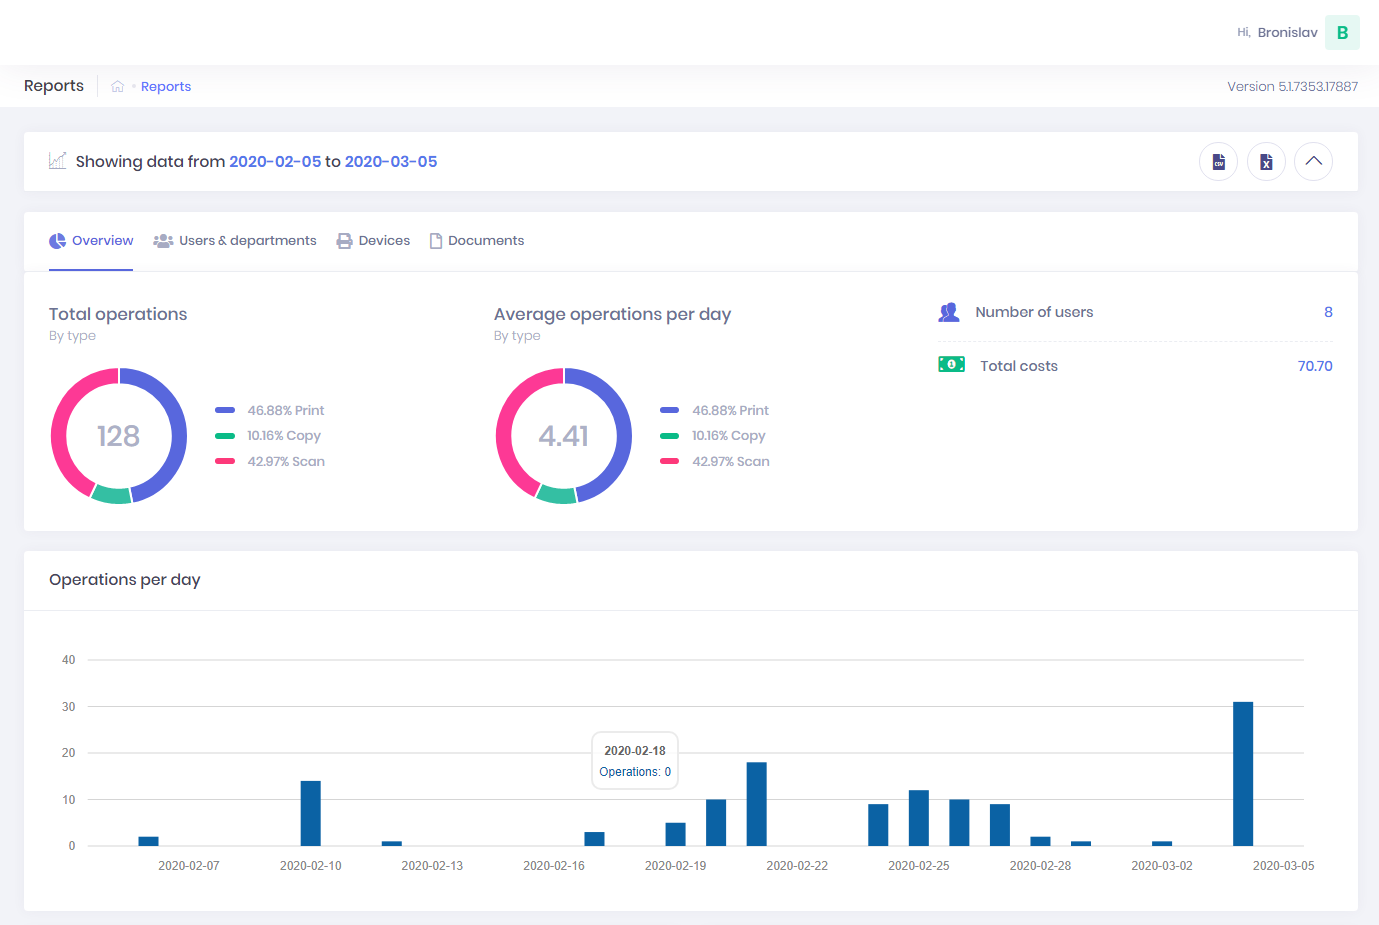
Overview report is collected by a set of widgets providing general overview of reporting data.


The widgets are following:
- Total operations - doughnut chart of the total operations in selected date range to particular type.
- Average operations per day - doughnut chart of the average amount of all operations per day.
- Number of users - number of users who realized some operation in defined date range.
- Total costs - total cost for all operations in defined date range.
- Operations per day - column chart providing an overview of utilization per day.
- Printing - Full color vs black & white job pages - doughnut chart of the total amount of pages per color and black & white
- Printing - Full color vs black & white job costs - doughnut chart of the total amount of cost per color and black & white
- Top 10 by price - table providing information about users with the biggest cost in defined date range. The Administrator can see the detailed list of operations by clicking on Operation list.