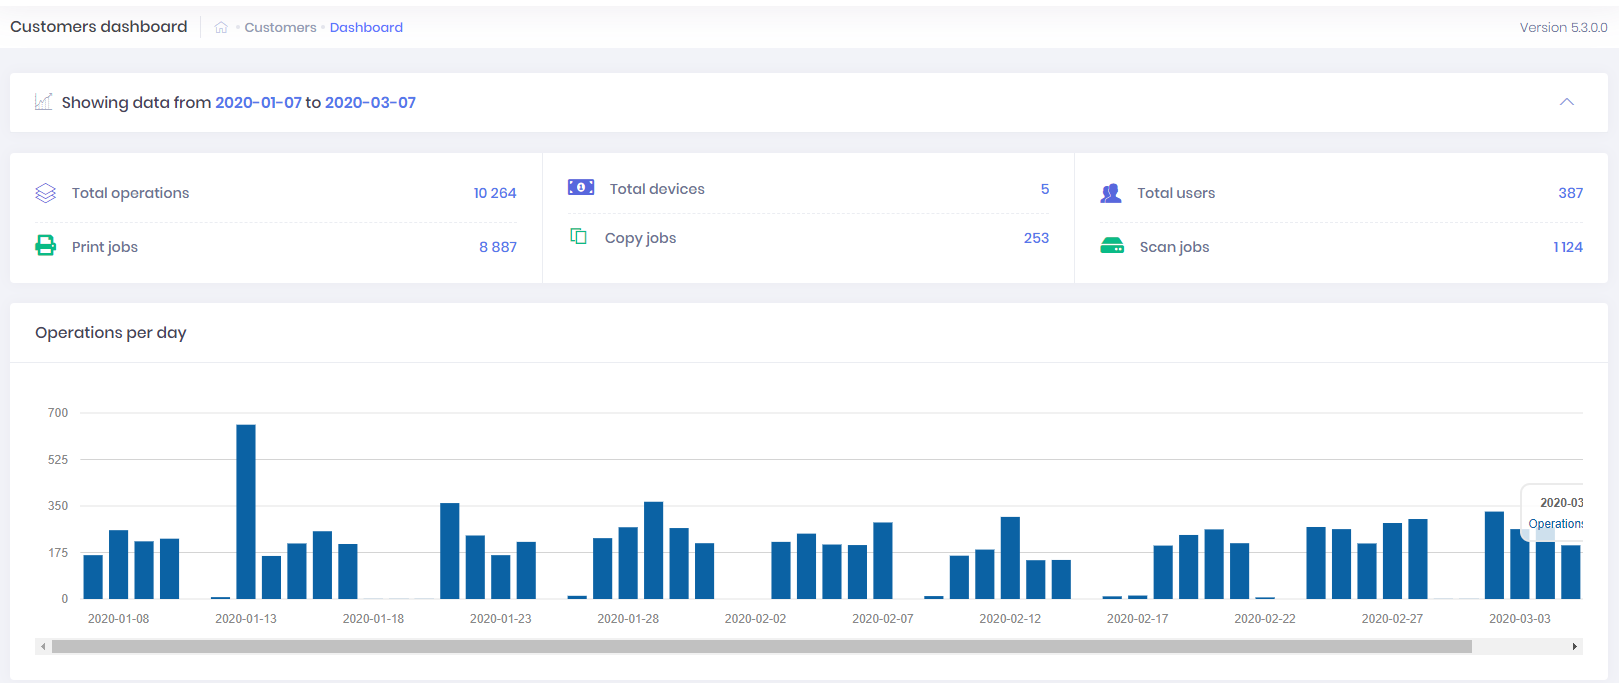
Dashboard
The Dashboard provides an overview of customers activity from the past. It does this by using a collection of widgets that are described below.


The functions and widgets are following:
- Filter - After expanding, you can filter a time period to show data for dashboard overviews.
- Information about*:
- total operations - number of operations in defined time period
- total devices - number of devices
- total users - number of users
- print jobs - number of print jobs in defined time period
- copy jobs - number of copy jobs in defined time period
- scan jobs - number of scan jobs in defined time period
- Operations per day widget*- column chart providing an overview of utilization per day
- Full color vs black & white print jobs widget* - doughnut chart of the total amount of pages per color and black & white
- Top 10 customers widget - table providing information about customers with the biggest number of operations in defined date range.
*numbers are shown for all customers